 Financial Analysis Portfolio
Project Showcase
Real-world financial expertise demonstrated through interactive dashboards, comprehensive valuation models, and data-driven insights
Financial Analysis Portfolio
Real-world financial expertise demonstrated through interactive dashboards, comprehensive valuation models, and data-driven insights
Core financial analysis projects demonstrating expertise in data visualization, valuation modeling, and strategic insights
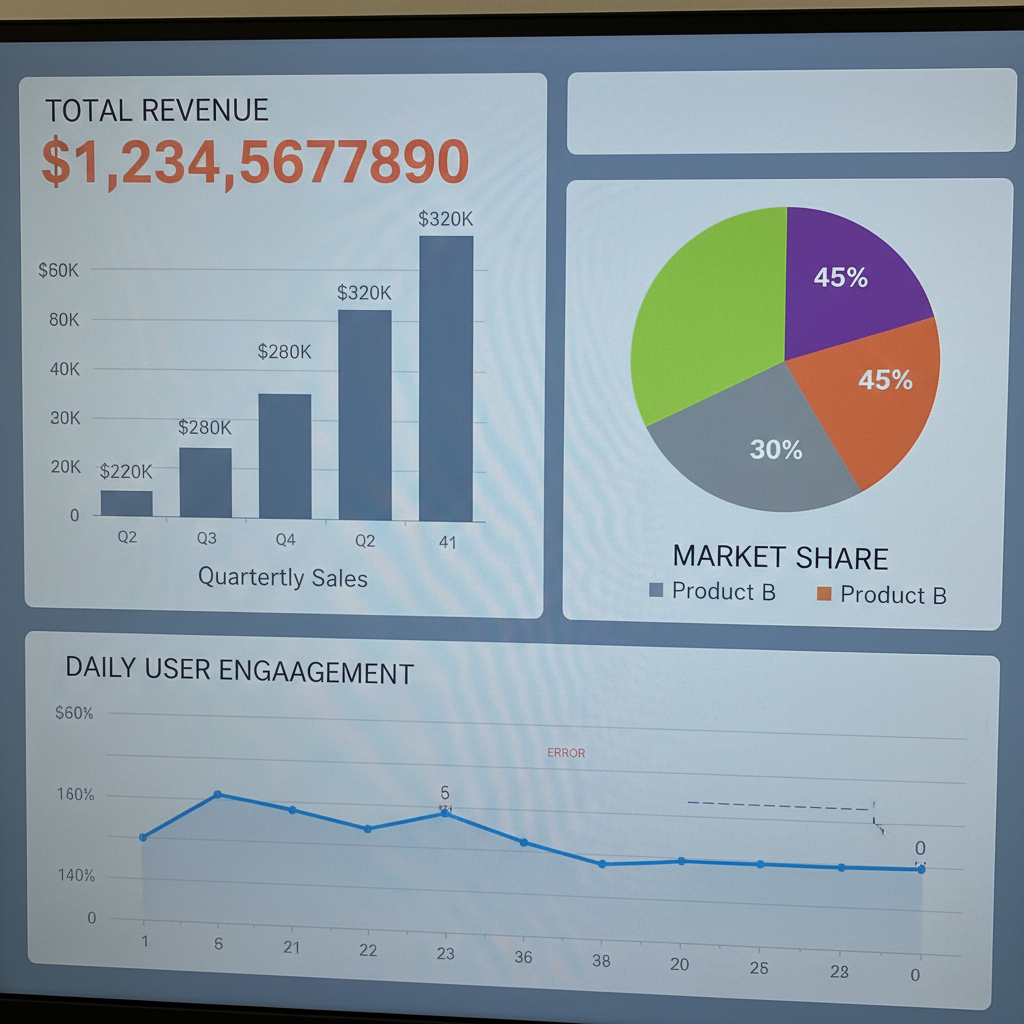
Interactive dashboard analyzing $1.2M revenue streams across multiple business segments with real-time KPI tracking and predictive analytics.
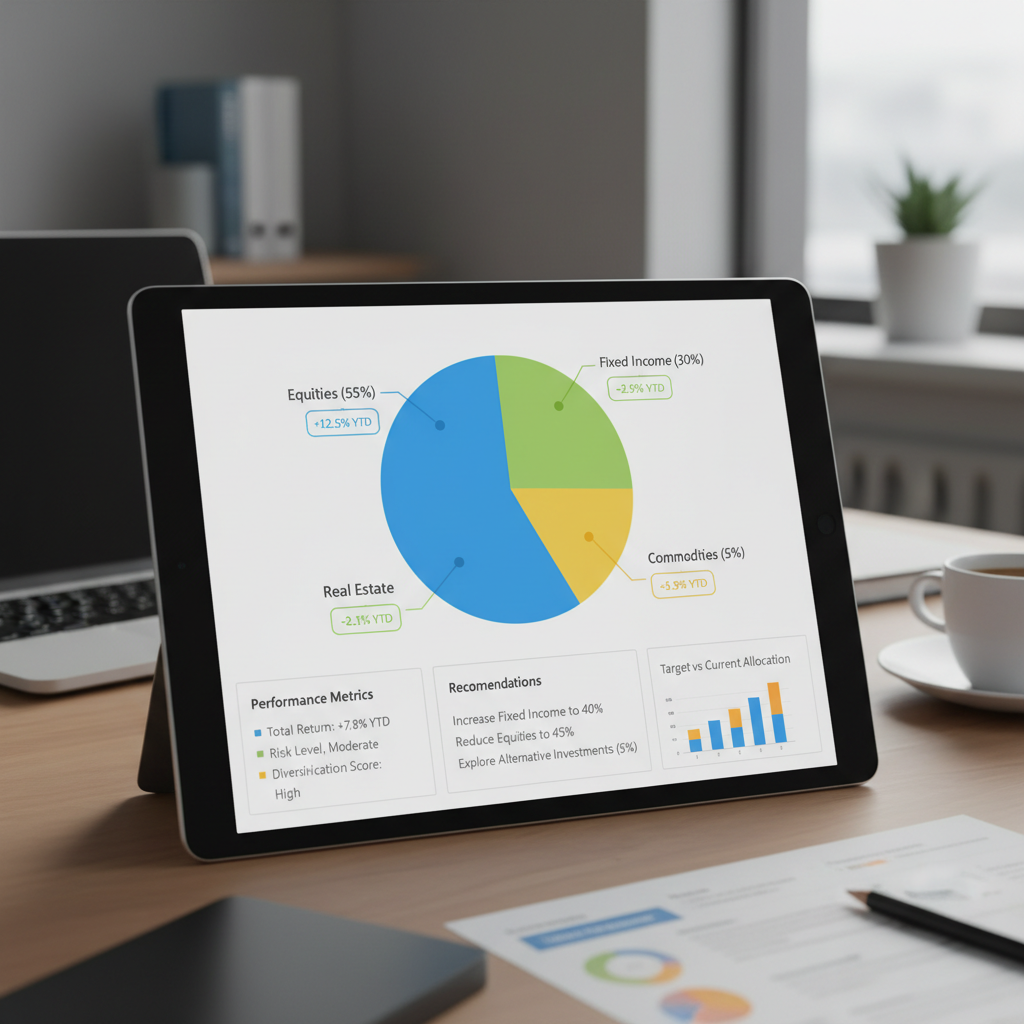
Comprehensive portfolio management system tracking $800K in diversified investments with automated risk assessment and rebalancing recommendations.
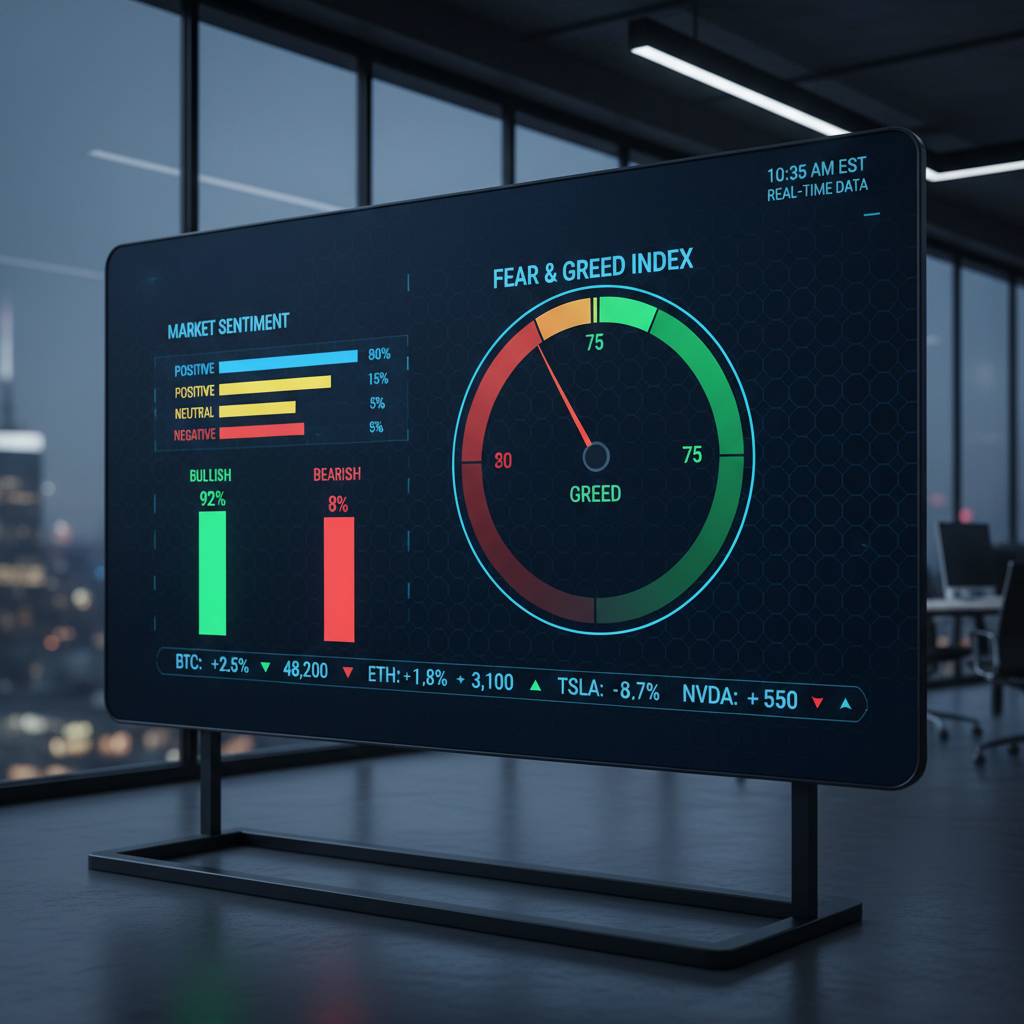
Real-time market analysis dashboard tracking 50+ stocks with predictive modeling, sentiment analysis integration, and technical indicator overlays.

Comprehensive DCF valuation model for mid-cap technology company with scenario analysis, sensitivity tables, and comparable company benchmarking.
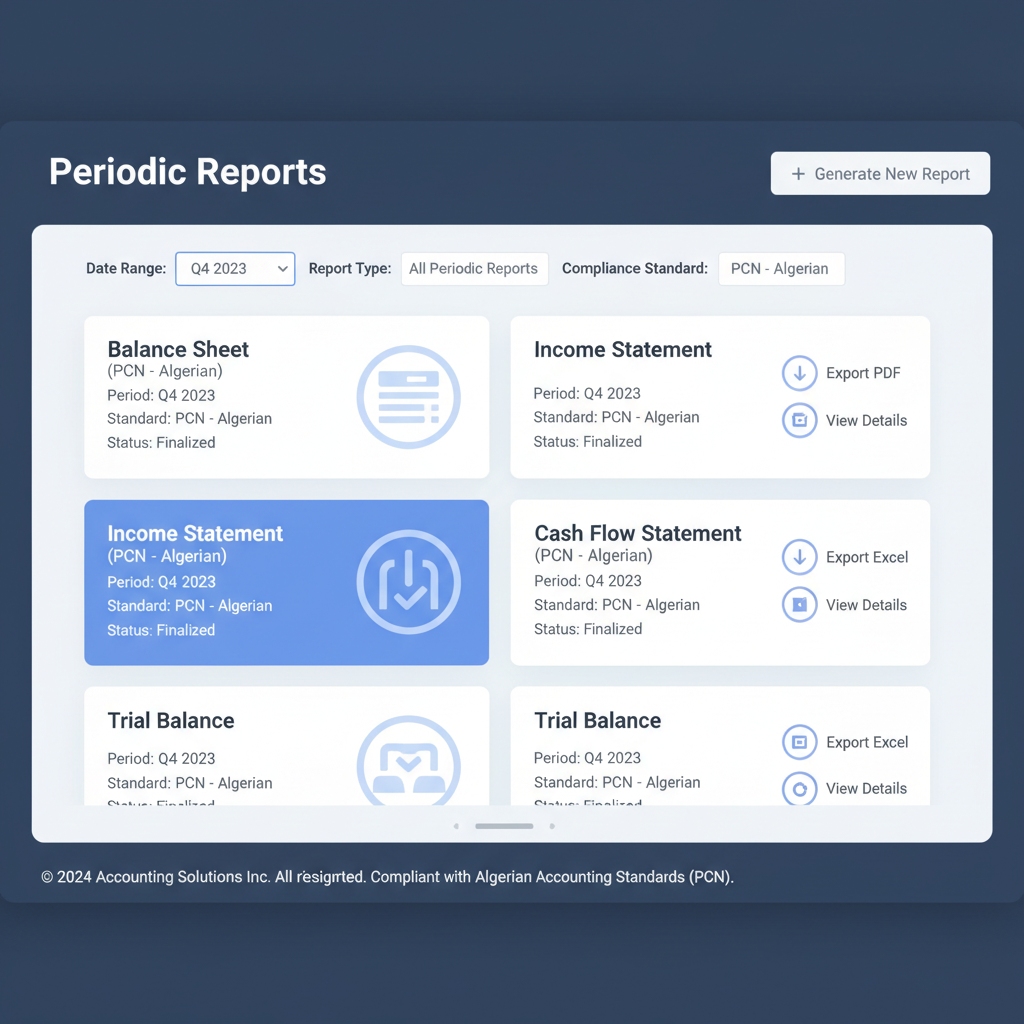
Interactive dashboard for comprehensive financial statement analysis with ratio calculations, trend analysis, and peer benchmarking across 5 years of data.

Dynamic budget planning and forecasting tool with variance analysis, rolling forecasts, and scenario planning capabilities for $2.5M annual budget.

Try adjusting your filters or search terms
A systematic approach to transforming financial data into actionable insights
 1
1
Understanding business objectives, data sources, and key stakeholders to define project scope and success metrics
 2
2
Gathering data from multiple sources, validating accuracy, and transforming into analysis-ready format
 3
3
Applying financial analysis techniques, building models, and extracting meaningful insights from data patterns
 4
4
Creating interactive dashboards and presenting findings with clear recommendations for decision-makers
Templates, calculators, and guides to help you get started with financial analysis

Complete Excel template with automated calculations for discounted cash flow analysis
Interactive tool for calculating and interpreting key financial ratios

Comprehensive PDF guide covering fundamental and technical analysis techniques
Have a project in mind? Let's discuss how data-driven financial analysis can help achieve your goals